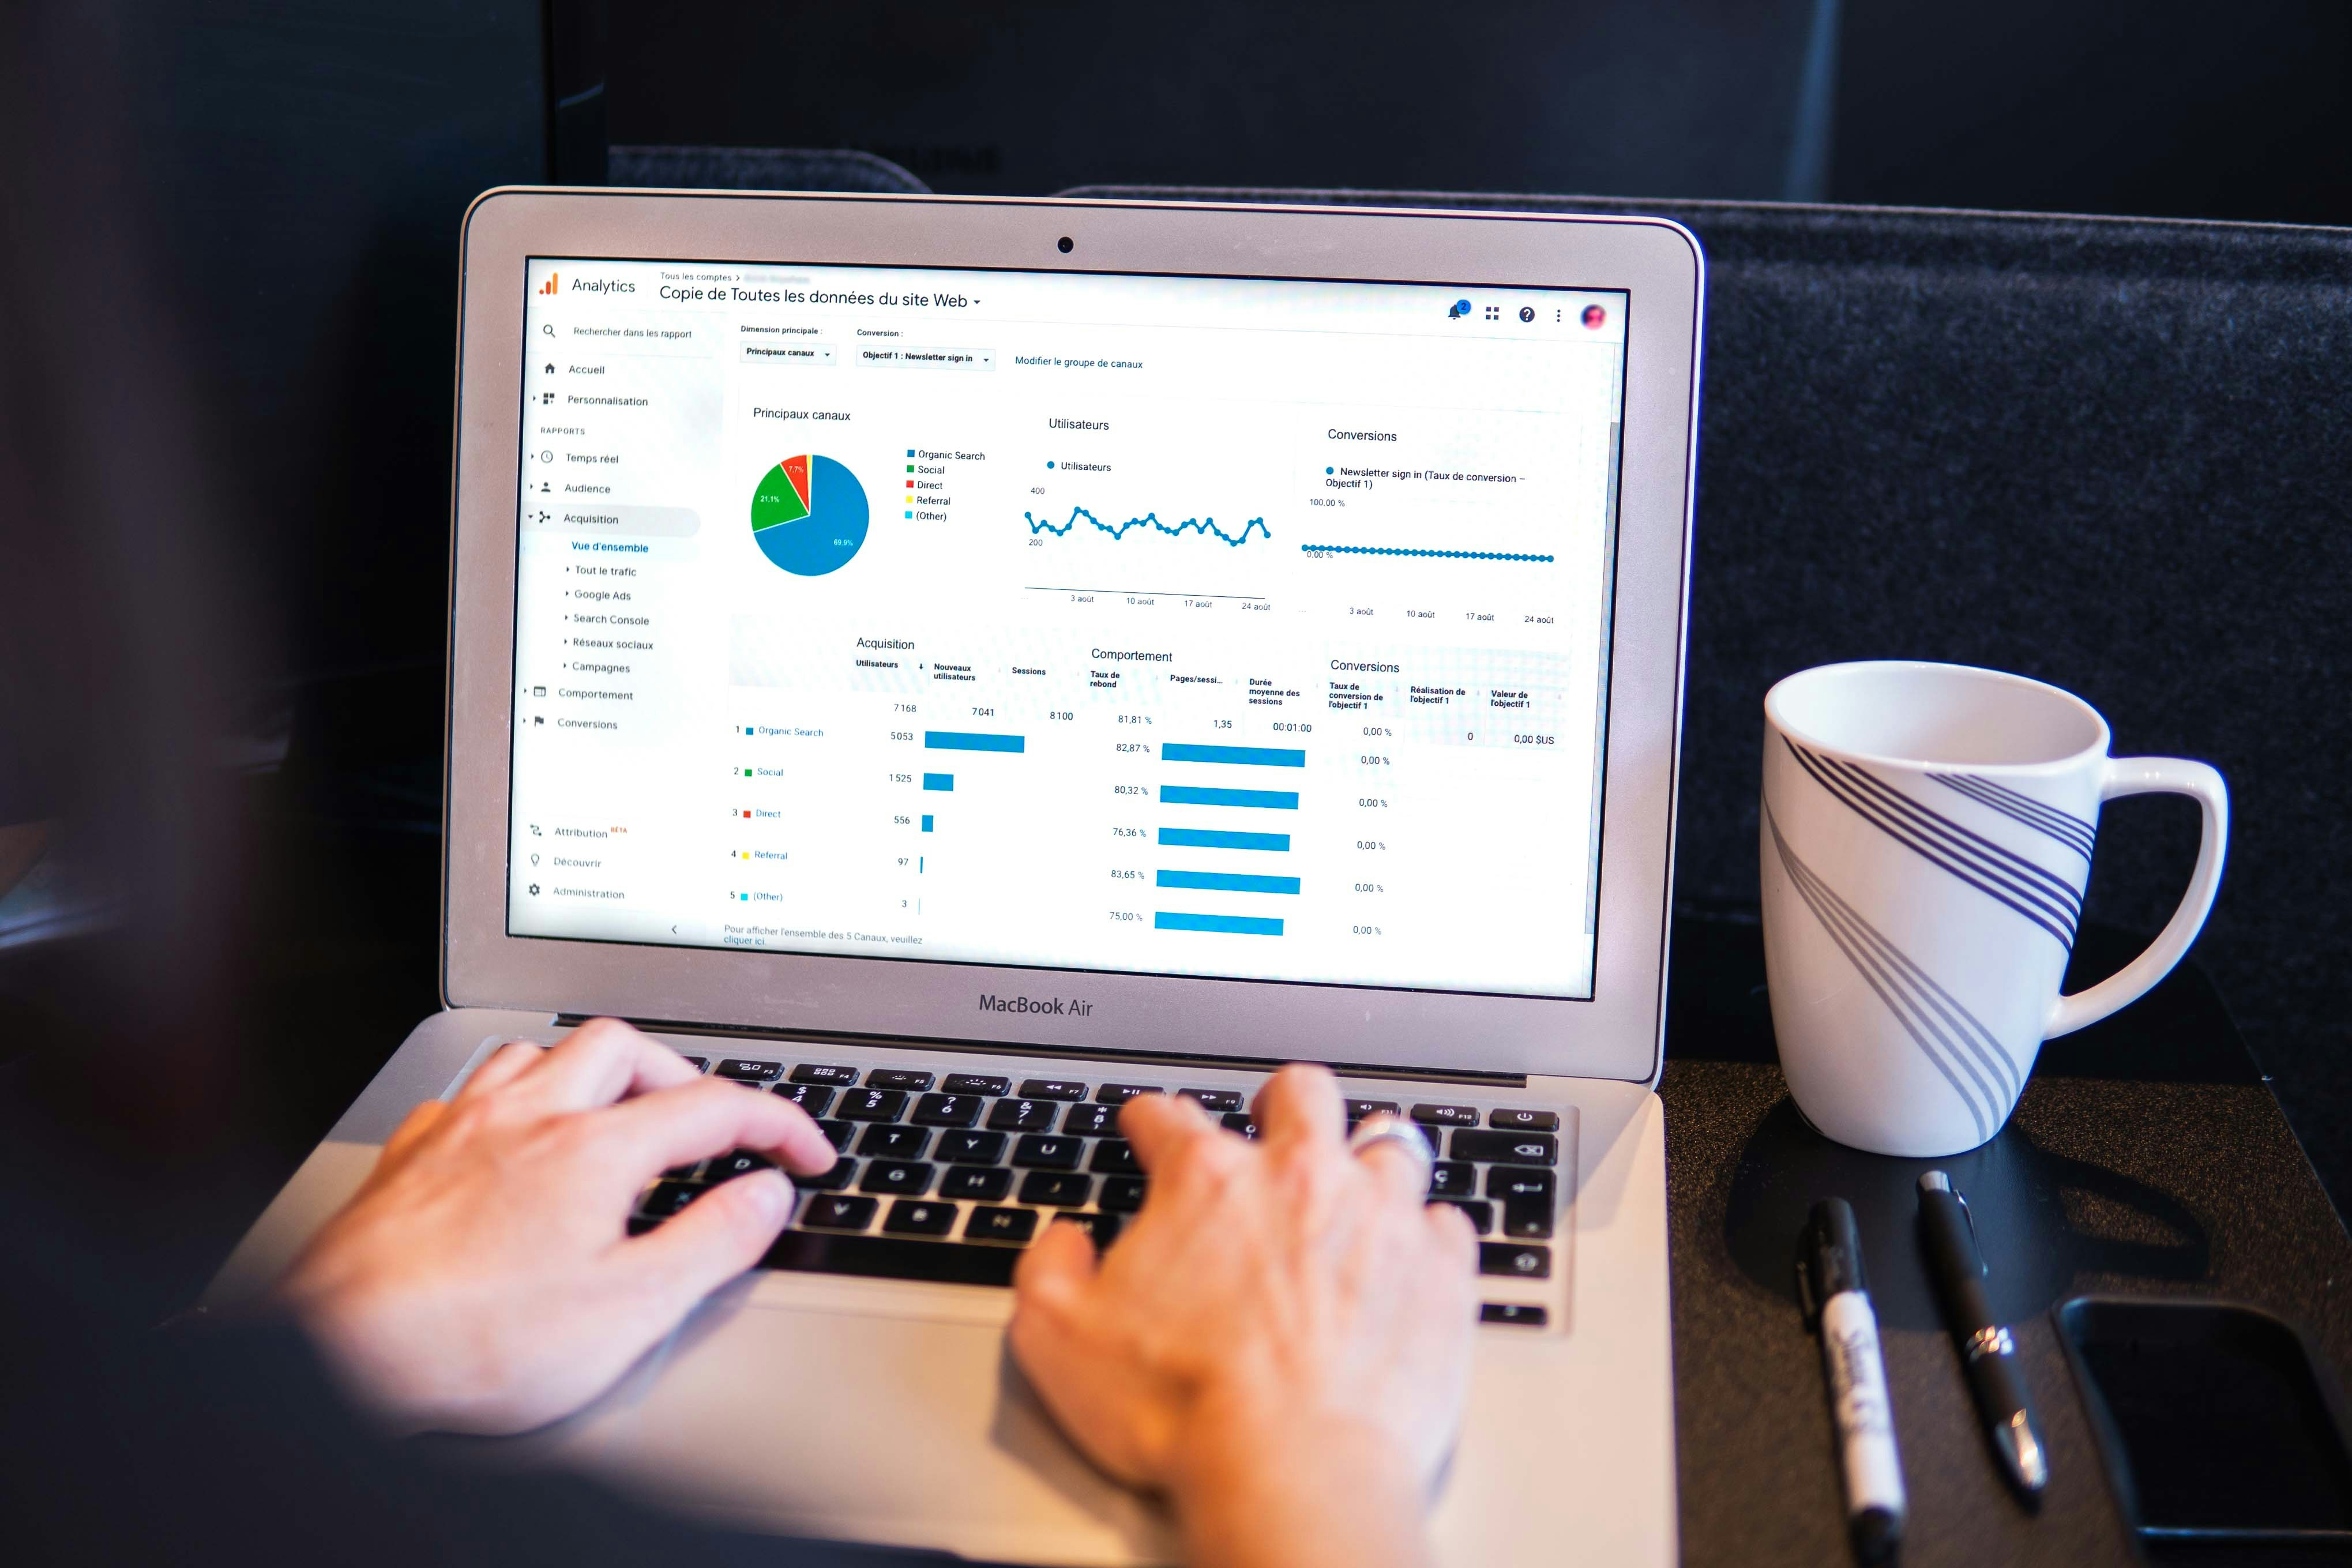
Explore how one company translated business questions into a fully functional custom dashboard with real-time analytics and visualization.
Every company wants better visibility—but building the right dashboard requires thoughtful design, aligned data, and clear goals. This case study walks through how one organization achieved that with a step-by-step custom build.
From initial scoping to final deployment, see how this business created a real-time dashboard that helps monitor KPIs, improve performance, and communicate impact.
From scoping to deployment, the full project took around 6 weeks with a small analytics team and stakeholder input.
Yes. The team designed it modularly with filters, query optimization, and future integration with other BI tools in mind.
The off-the-shelf tools lacked flexibility for specific KPIs, data sources, and team workflows. Custom gave them full control.
Training sessions, shared ownership, and KPI alignment made adoption smooth—plus user-friendly UI encouraged daily use.
This case study shows how any business—with the right plan—can move from scattered data to clear dashboards. The result? Faster decisions, better visibility, and alignment across teams.
A custom dashboard is more than just charts—it's a reflection of your business goals, strategy, and how you choose to act on data.
Whether you need video editing, web development, or more, we're here to help you achieve your goals. Reach out to us today!
Discover Custom Solutions
At OrganicOpz, We Specialize In Crafting Tailored Strategies To Elevate Your Online Presence. Let's Collaborate To Achieve Your Digital Goals!
Share Your Idea Or Requirement — We’ll Respond With A Custom Plan.
Give Us A Call On Our Phone Number For Immediate Assistance Or To Discuss Your Requirements.
Feel Free To Reach Out To Us Via Email For Any Inquiries Or Assistance You May Need.
Our Standard Operating Hours Are From 4:00 To 16:00 Coordinated Universal Time (UTC).