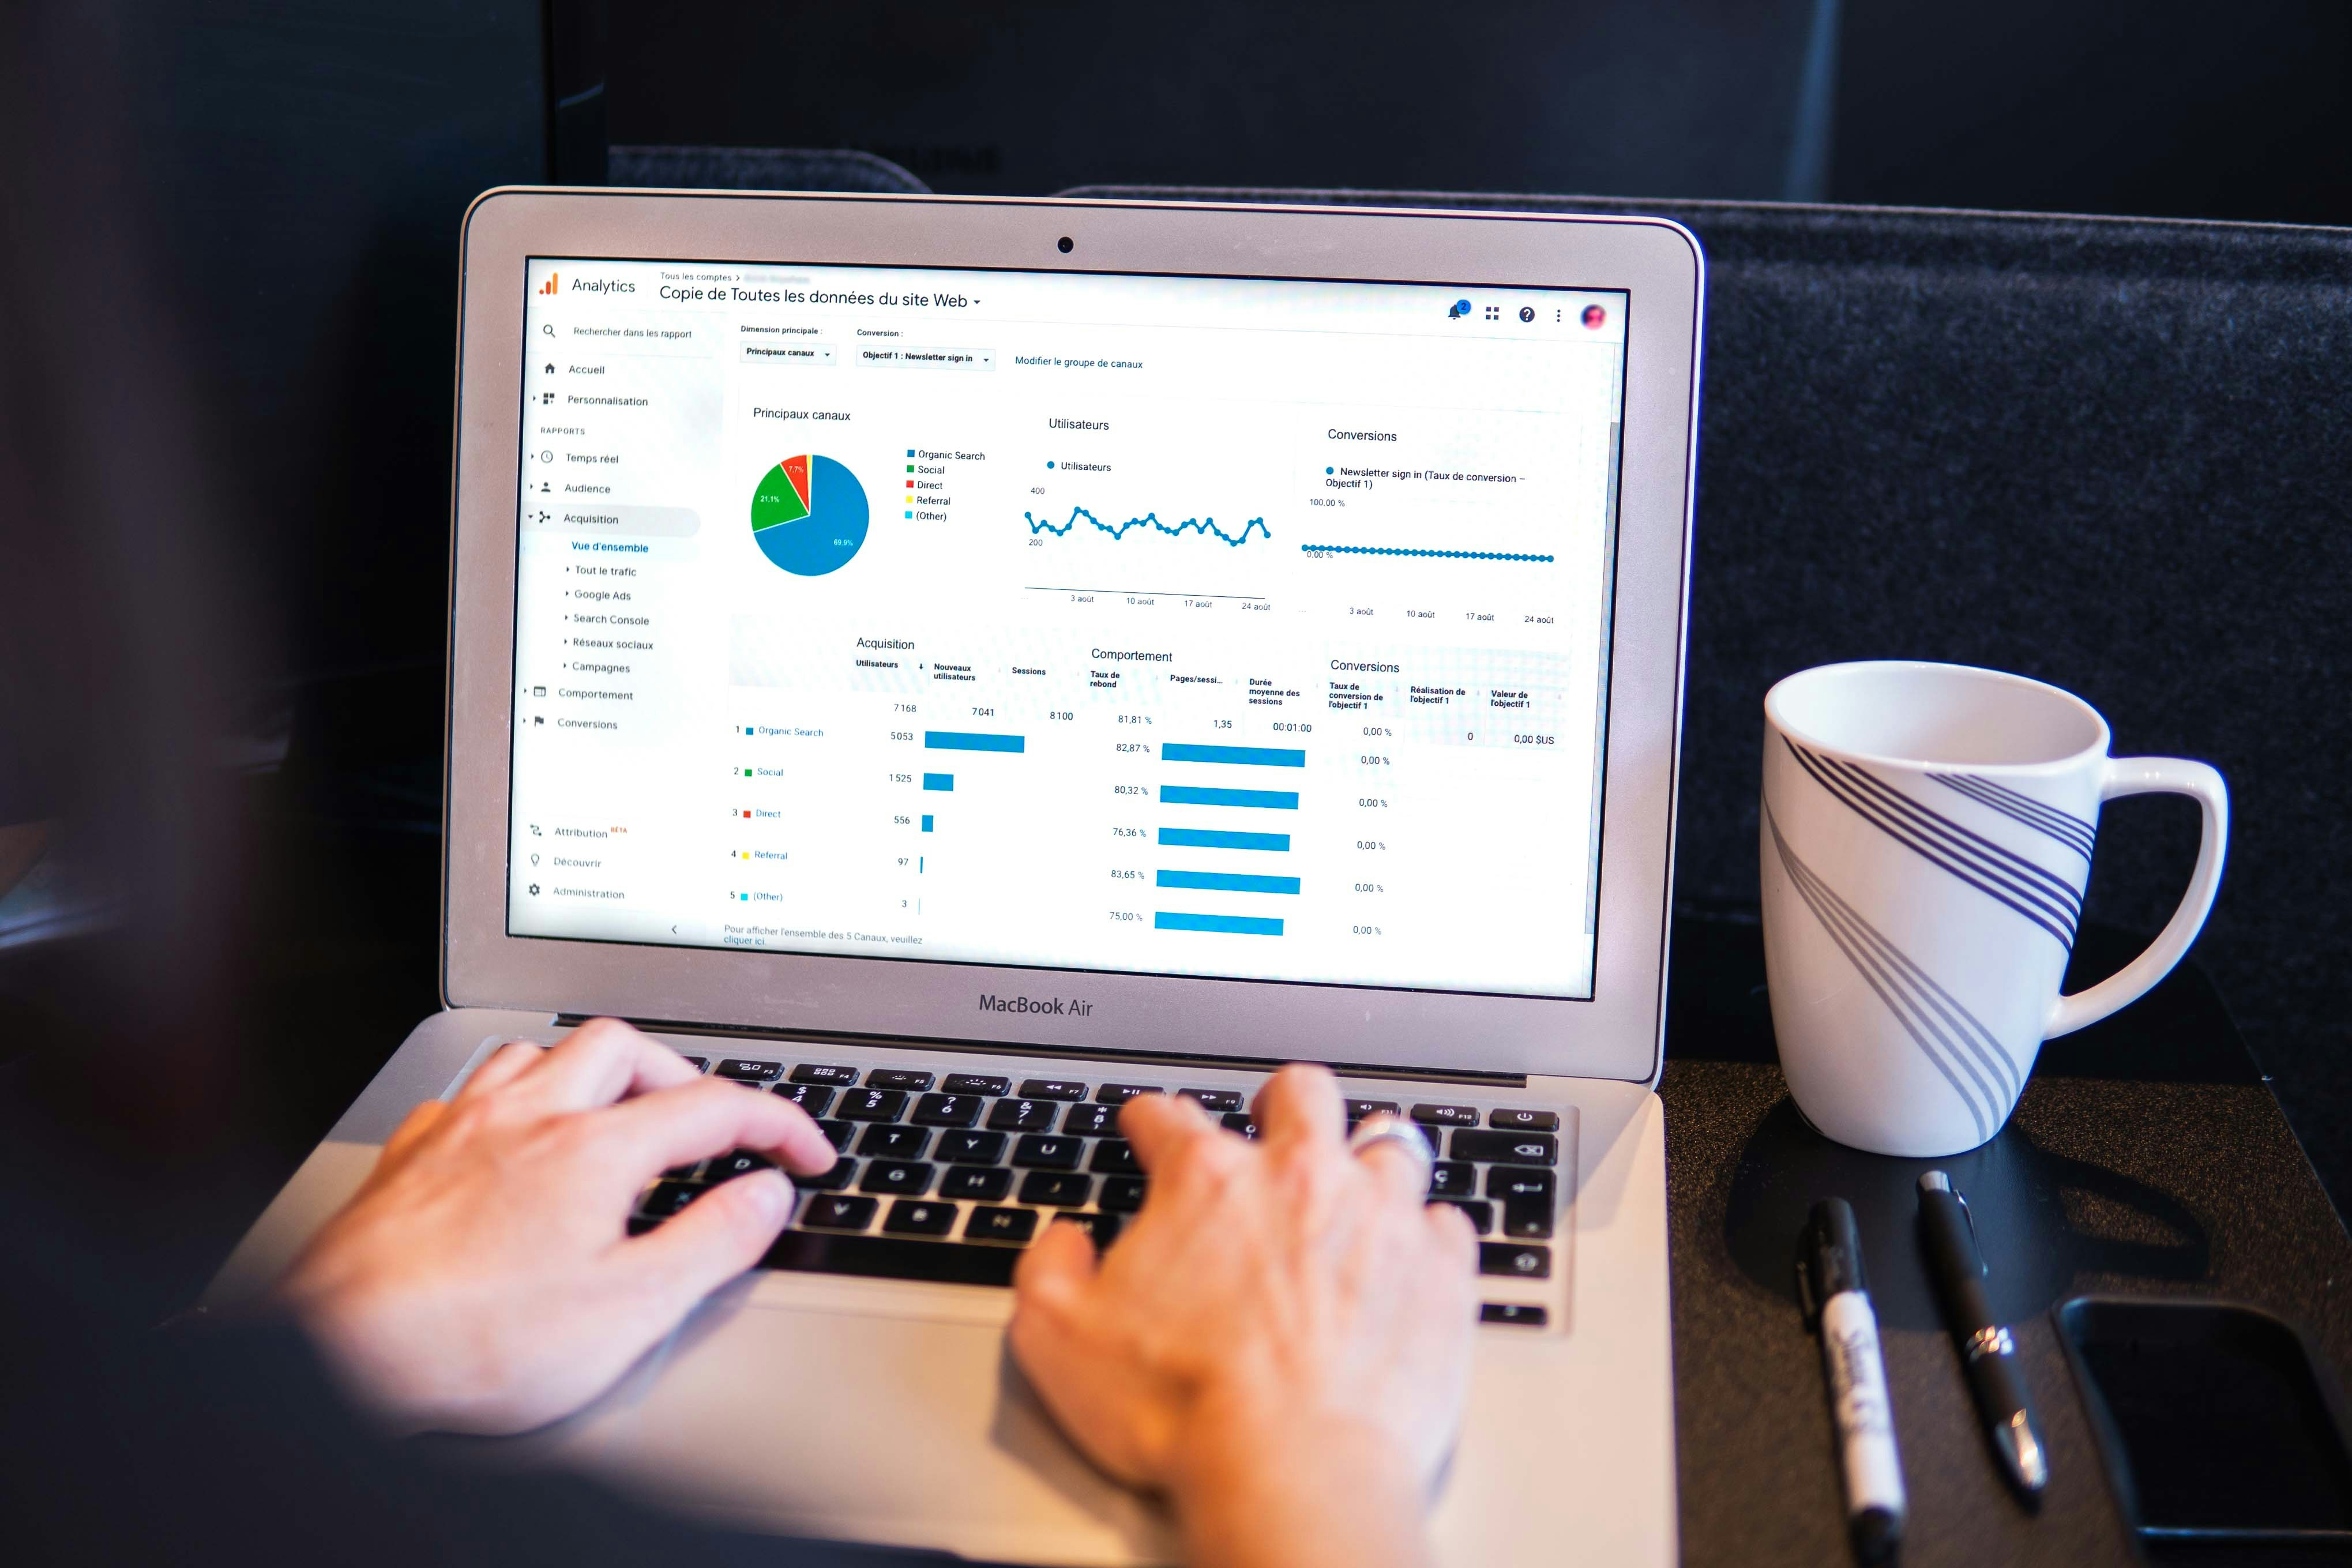
Make the most of your analytics by learning how to read reports effectively—spotting trends, patterns, and actions hidden in the numbers.
Data analysis reports are full of valuable insights—but they can also feel overwhelming. To make smarter decisions, you need to know how to interpret these reports clearly and confidently.
In this guide, we’ll walk you through how to read common sections of a report, what to focus on, and how to turn data into action.
Ask for a simplified summary or visual representation. Analysts can often translate complexity into actionable language.
Check for notes on data sources and methodology. Trustworthy reports include transparent assumptions and known limitations.
Yes. Well-read reports can guide strategic planning, budgeting, hiring, and product decisions.
It depends on your role, but monthly reviews are common—while fast-moving teams may check dashboards daily.
Reading data reports isn’t about memorizing metrics—it’s about asking better questions, spotting trends, and turning numbers into narratives.
With a little practice, you can make every report a strategic asset—and become the go-to voice for data-informed decisions in your team.
Whether you need video editing, web development, or more, we're here to help you achieve your goals. Reach out to us today!
Discover Custom Solutions
At OrganicOpz, We Specialize In Crafting Tailored Strategies To Elevate Your Online Presence. Let's Collaborate To Achieve Your Digital Goals!
Share Your Idea Or Requirement — We’ll Respond With A Custom Plan.
Give Us A Call On Our Phone Number For Immediate Assistance Or To Discuss Your Requirements.
Feel Free To Reach Out To Us Via Email For Any Inquiries Or Assistance You May Need.
Our Standard Operating Hours Are From 4:00 To 16:00 Coordinated Universal Time (UTC).