Turn raw data into meaningful stories and strategic decisions with professional data visualization and reporting solutions.
In today's data-saturated business landscape, numbers alone aren't enough. Stakeholders need visuals that make sense, dashboards that answer questions, and reports that inspire action. That’s where visualization and reporting services come in—translating complex datasets into interactive stories and performance insights.
By combining design thinking, data literacy, and modern BI tools, businesses can communicate trends, compare performance, and unlock real-time decision-making at every level.
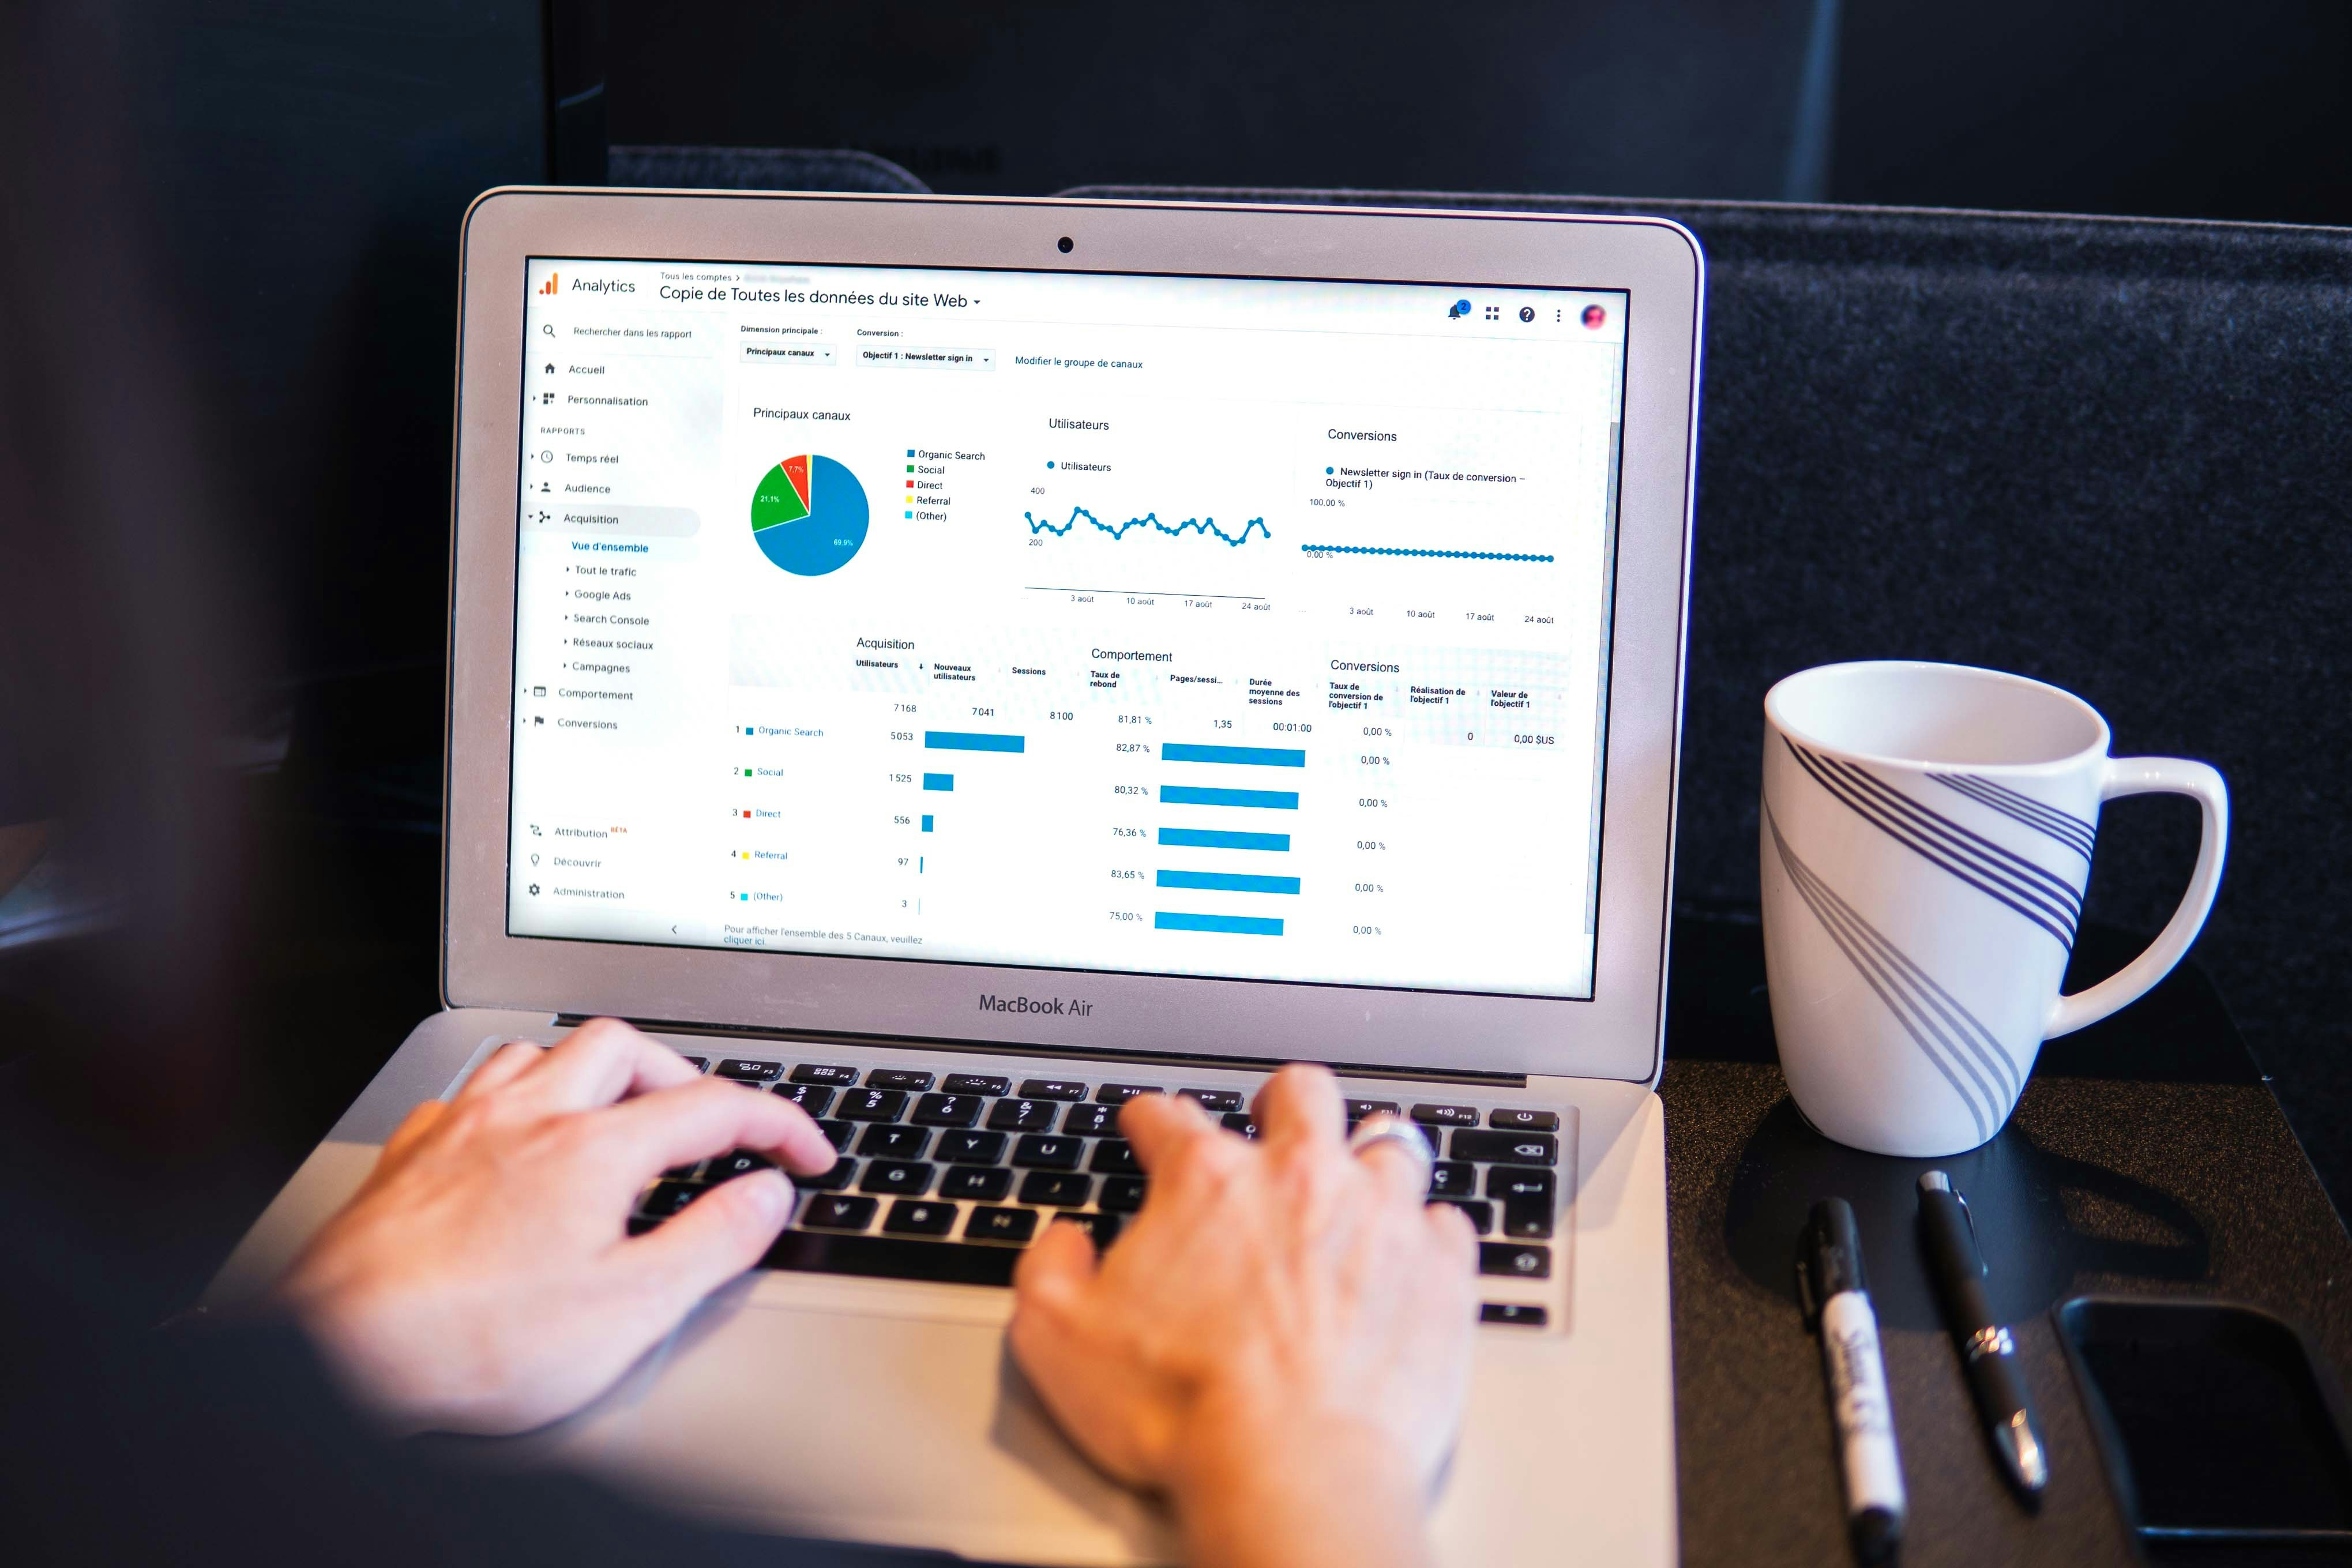
Interactive dashboards and clear charts help uncover insights from multi-source data—making it easier to spot trends, risks, and opportunities.
Modern reporting platforms enable real-time visibility so decision-makers can respond quickly to KPIs, metrics, and performance gaps.
Cohesive visual frameworks ensure that insights are communicated clearly and consistently across departments and teams.
From boardroom presentations to operational monitoring, visualization and reporting tools support use cases across industries:
Reporting refers to structured data summaries (tables, PDF reports), while visualization focuses on graphical representations (charts, maps, dashboards) that enable exploration and storytelling.
Yes. Most platforms like Power BI, Tableau, and Looker support scheduled refreshes, real-time syncs, and embedded alerts for fully automated pipelines.
Not always. Many BI tools offer drag-and-drop interfaces and templates. However, for client-facing or high-stakes dashboards, design experts ensure clarity and consistency.
Absolutely. Leading tools offer native connectors for Salesforce, HubSpot, SAP, Oracle, and hundreds of APIs—reducing data silos and integration delays.
Visualization and reporting services bridge the gap between data and action. When insights are delivered with clarity, consistency, and visual elegance, teams are empowered to make faster, smarter decisions—every day.
By investing in professional visualization services, organizations not only improve communication—they elevate how data informs strategy, operations, and growth. With the right tools and expertise, your data becomes a visual asset, not just a backend resource.
Whether you need video editing, web development, or more, we're here to help you achieve your goals. Reach out to us today!
Discover Custom Solutions
At OrganicOpz, We Specialize In Crafting Tailored Strategies To Elevate Your Online Presence. Let's Collaborate To Achieve Your Digital Goals!
Share Your Idea Or Requirement — We’ll Respond With A Custom Plan.
Give Us A Call On Our Phone Number For Immediate Assistance Or To Discuss Your Requirements.
Feel Free To Reach Out To Us Via Email For Any Inquiries Or Assistance You May Need.
Our Standard Operating Hours Are From 4:00 To 16:00 Coordinated Universal Time (UTC).
