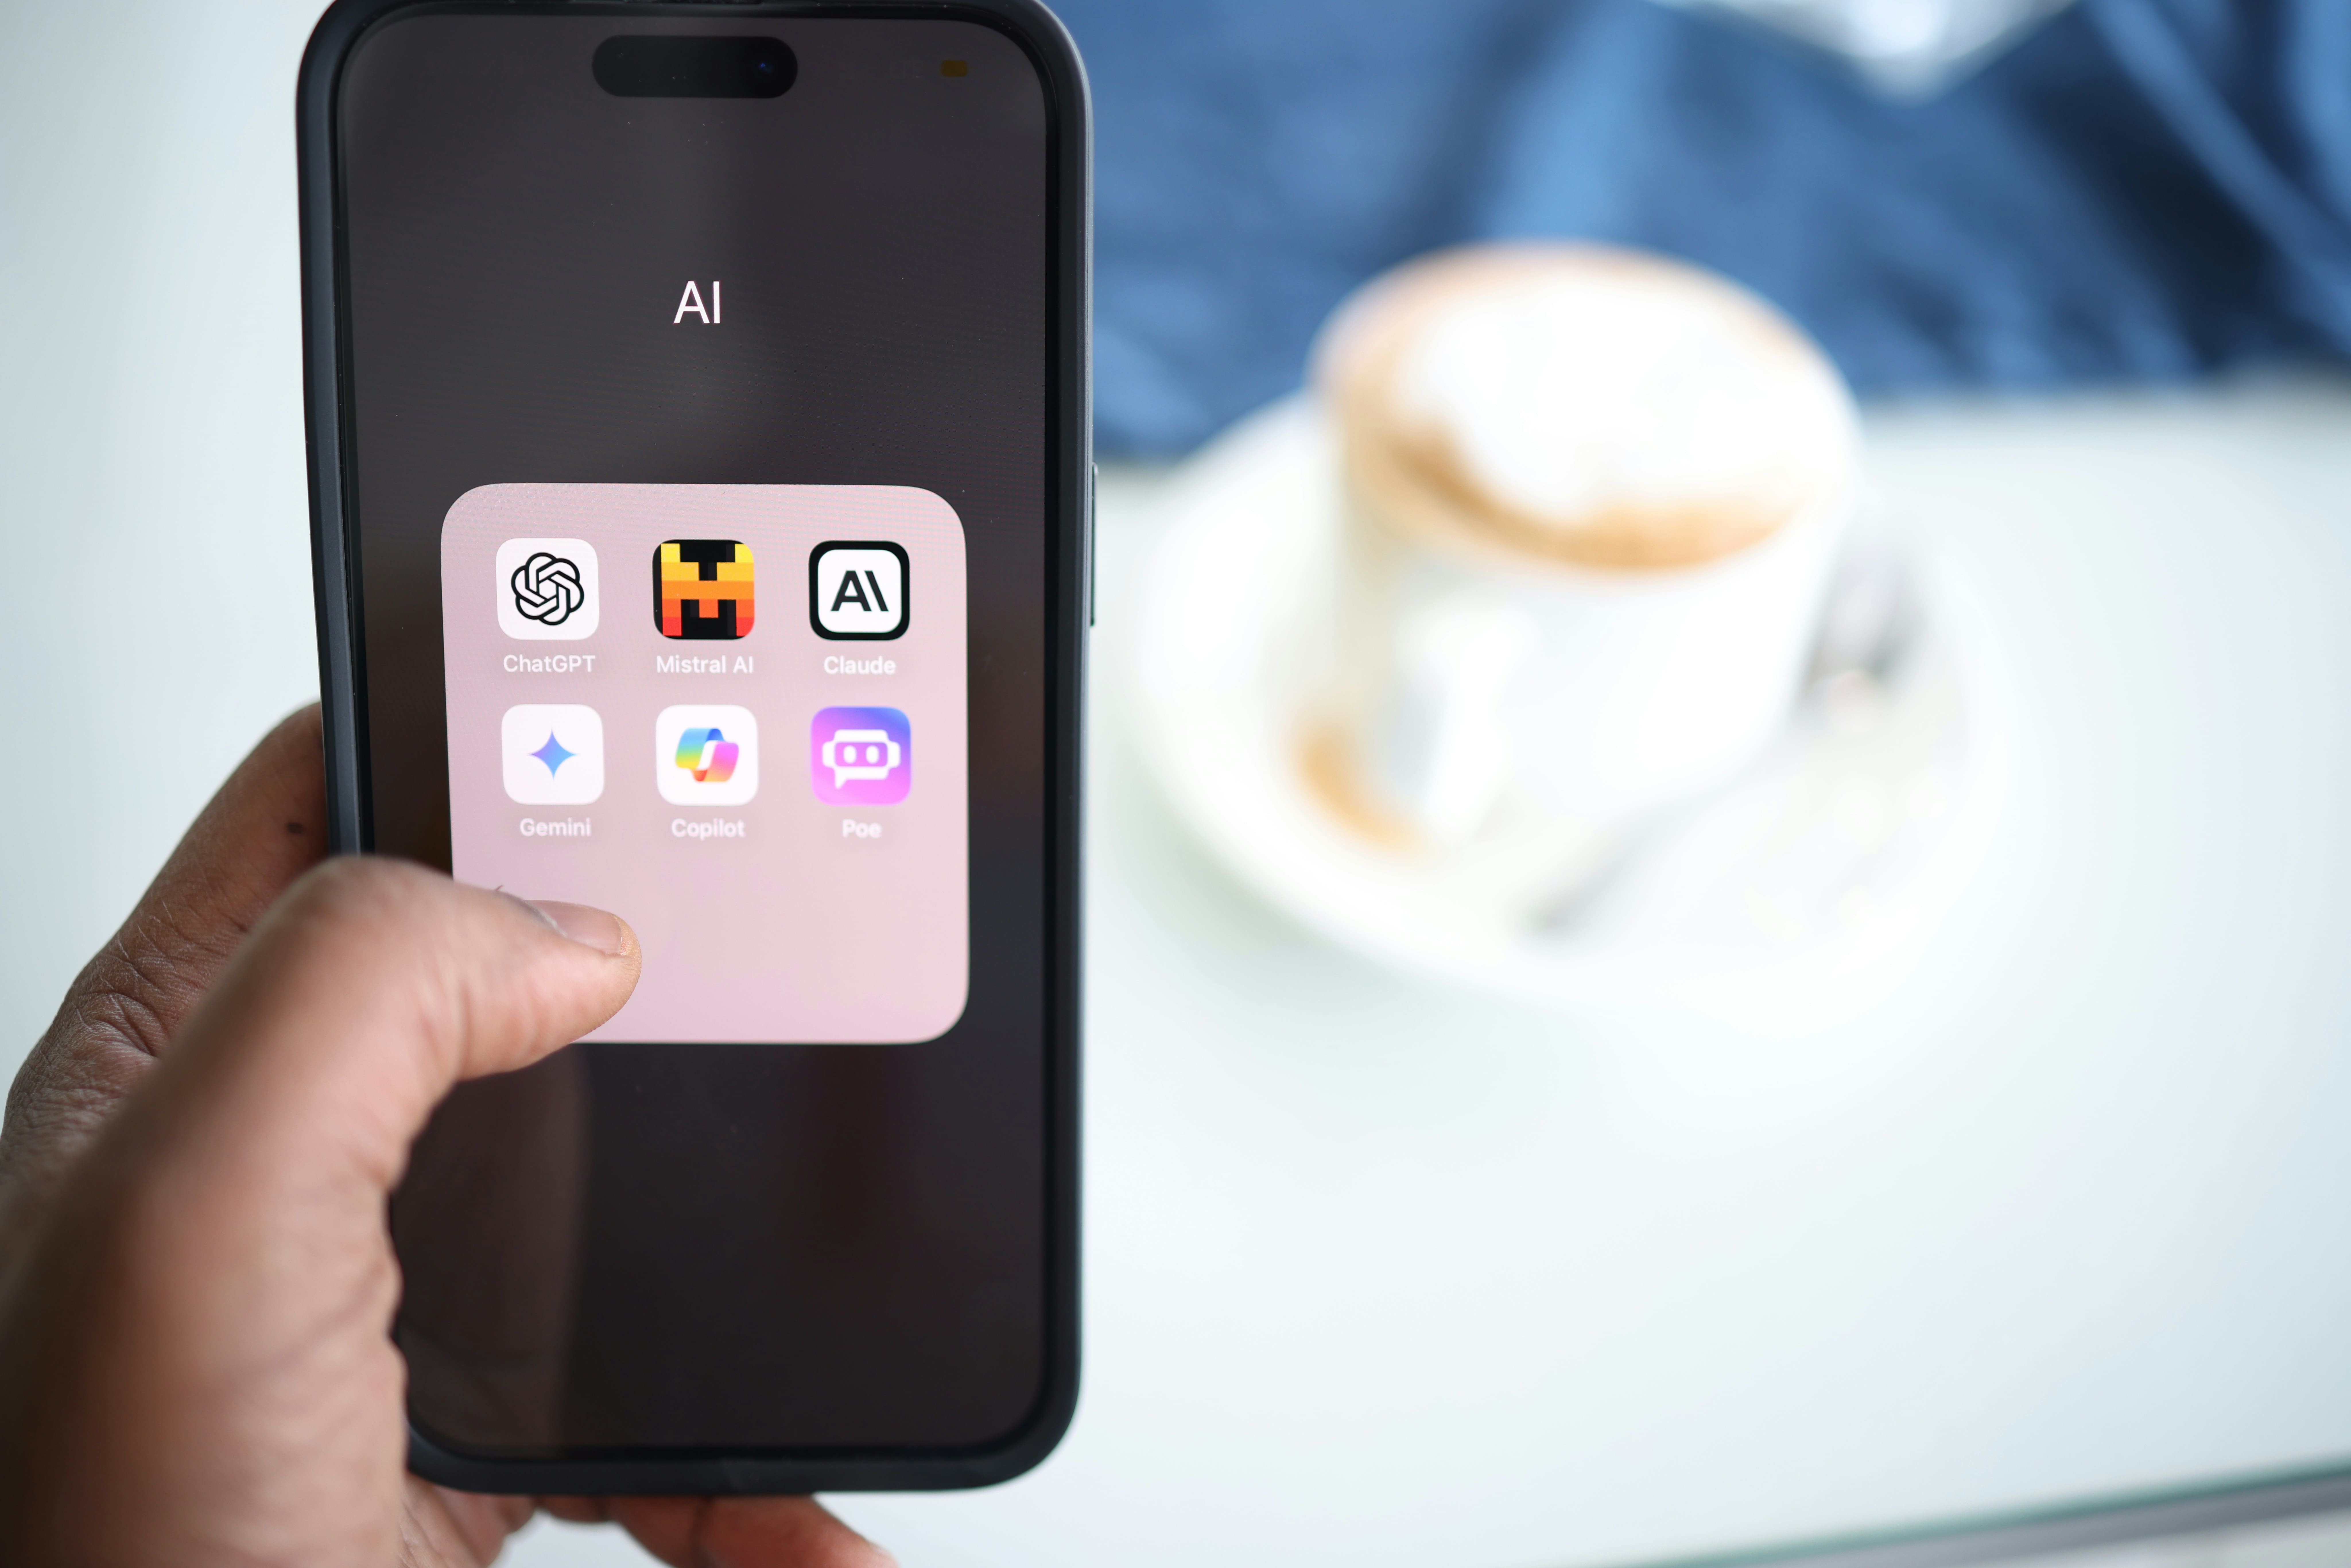
Explore how AI is evolving dashboards and charts into dynamic, interactive, and narrative-rich experiences powered by data and natural language
Data is powerful—but only when it’s understood. Traditional dashboards often leave stakeholders guessing what matters most. With Generative AI, data visualization becomes smarter, more accessible, and instantly contextual. AI can now analyze data, detect trends, choose the best charts, and narrate what it means—all in seconds.
In this blog, we explore how Generative AI application development services are empowering organizations to deliver auto-generated, interactive, and insight-driven visuals that speak directly to decision-makers.
A fast-scaling retail chain integrated a generative AI assistant into their analytics platform. Instead of static charts, leaders could ask 'What caused the sales spike in Region C last quarter?'—and get not only a graph, but a narrative with key contributors, time comparisons, and action suggestions. This turned dashboards into decision-making tools, not just data snapshots.
Humans process visuals 60,000x faster than text, but many business users still struggle to interpret charts without context. Generative AI bridges the gap by turning complex data into visual stories—making insights accessible across teams, regardless of technical expertise.
AI-driven visuals foster faster alignment, clearer reporting, and more confident strategies.
Generative AI has turned data storytelling from a skillset into a service. Whether you’re reporting to clients, informing internal teams, or building BI tools, AI-enhanced visualizations offer speed, clarity, and insight like never before. With custom Generative AI application development services, your data can finally speak for itself—visually and intelligently.
Whether you need video editing, web development, or more, we're here to help you achieve your goals. Reach out to us today!
Discover Custom Solutions
At OrganicOpz, We Specialize In Crafting Tailored Strategies To Elevate Your Online Presence. Let's Collaborate To Achieve Your Digital Goals!
Share Your Idea Or Requirement — We’ll Respond With A Custom Plan.
Give Us A Call On Our Phone Number For Immediate Assistance Or To Discuss Your Requirements.
Feel Free To Reach Out To Us Via Email For Any Inquiries Or Assistance You May Need.
Our Standard Operating Hours Are From 4:00 To 16:00 Coordinated Universal Time (UTC).